
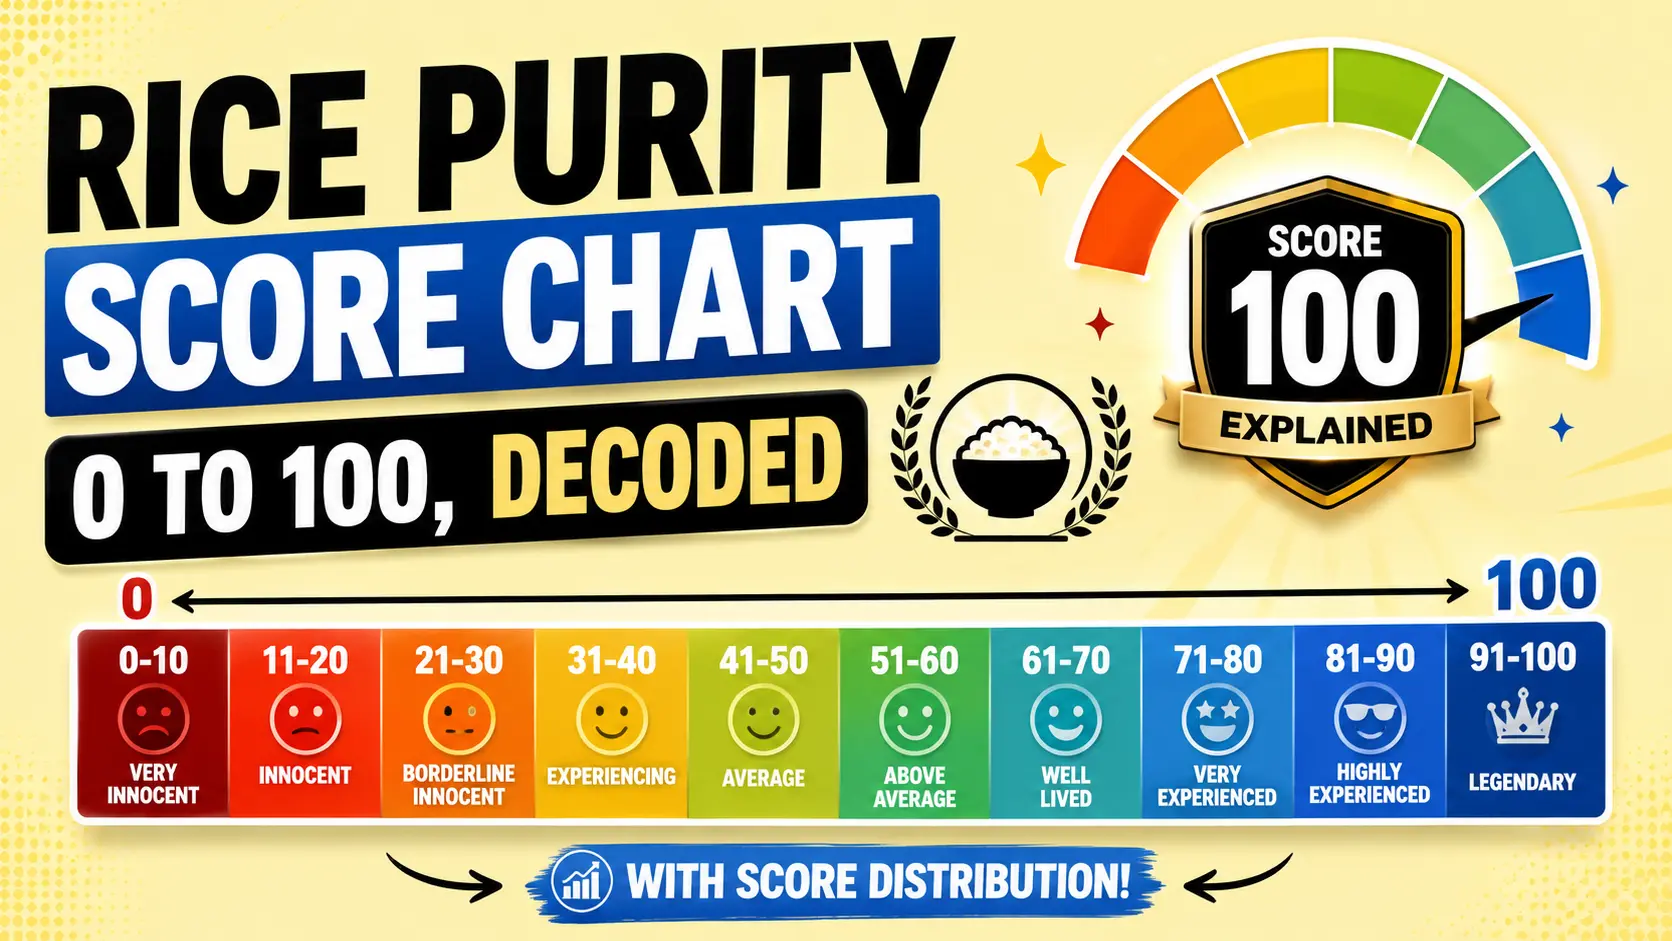
Quick Answer: The Rice Purity Test scores from 0 to 100, where 100 means you have not done any of the 100 listed activities and 0 means you have done all of them. Based on live data from real submissions on this site, the current average score is 74.26 and the most common range is 70–79, which alone accounts for 32.8% of all test-takers. A higher number means less life experience with the behaviors on the list, not moral superiority.
Rice Purity Score Chart (0–100) at a Glance
Definition: The rice purity score chart is a reference table that groups every possible Rice Purity Test result into labeled bands, each showing what that range indicates and how many real test-takers land there.
The distribution column below comes from live anonymous submissions recorded on ricepuritytest.bz, not from estimates or third-party surveys. Figures reflect data as of October 2026.
| Score Range | Band Label | What It Signals | Share of Test-Takers |
|---|---|---|---|
| 90–100 | Very Innocent | Little to no experience with the listed activities; the top tier of all submissions | ~10% |
| 80–89 | Mostly Innocent | A few mild firsts — dating, minor rule-breaking — and not much beyond that | 26.8% |
| 70–79 | Most Common Range | Standard relationship and social milestones; the true center of the distribution | 32.8% |
| 60–69 | Around Average | Broader experience across dating, drinking, and mild rule-breaking | 19.6% |
| 50–59 | Below Average | Roughly half the list checked; less common than most people assume | 6.8% |
| 26–49 | Highly Experienced | Extensive experience across nearly every category on the test | Under 10% |
| 0–25 | Extremely Rare | Almost the entire list checked; one of the rarest outcomes on the test | Under 1% |
Insight: The majority of test-takers land between 60 and 89. If your score sits in that window see your exact percentile, you are statistically ordinary regardless of how the number feels. Scores below 50 are genuinely uncommon — see the live Rice Purity Test statistics for the current exact percentages.
What Every Score From 0 to 100 Means (Detailed Chart)
The band chart above is the fast version. The table below breaks the same 0–100 range into 5-point steps, which is where the real differences show up — a 62 and a 68 look similar but usually mean different things.
| Score | Reading |
|---|---|
| 100 | A perfect score. No items checked at all — most common among users under 15. |
| 95–99 | One to five mild items, usually crushes, hand-holding, or a minor lie. |
| 90–94 | Early dating and light rule-breaking; nothing involving substances. |
| 85–89 | First kiss and first relationship checked; still no drinking or drugs. |
| 80–84 | Standard high school experience — dating, parties, some minor mischief. |
| 75–79 | The upper half of the most common band. Alcohol and longer relationships typically appear here. |
| 70–74 | The single densest stretch on the chart. If you scored here, you are almost exactly average. |
| 65–69 | Most social and dating items checked; sexual experience is typically present. |
| 60–64 | Broad experience across dating, drinking, and mild legal-gray behavior. |
| 55–59 | Meaningfully below average. Most mainstream items are checked. |
| 50–54 | Exactly half the list — already in the lower third of all submissions. |
| 45–49 | Well below average; the riskier third of the test starts filling in. |
| 40–44 | Extensive experience in every category, including several higher-risk items. |
| 35–39 | Only the most extreme entries remain unchecked. |
| 30–34 | Heavy experience across substances, relationships, and legal-gray territory. |
| 26–29 | Fewer than 30 items left unchecked. Uncommon among genuine submissions. |
| 20–25 | Nearly comprehensive experience, including items most people never check. |
| 15–19 | Rare territory. Often signals either an unusual life or a non-serious submission. |
| 10–14 | Almost the entire list checked. Statistically very rare. |
| 5–9 | Under ten unchecked items. Overwhelmingly joke or exaggerated responses. |
| 0–4 | Effectively the whole test checked. Treated as a novelty result, not a real one. |
What this means: Movement of one or two points is meaningless. The chart is useful at the band level, because each band represents a genuinely different pattern of life experience — not a ranking. Our guide to what your Rice Purity score means goes deeper on interpreting your specific number.
How the Rice Purity Score Is Calculated
The scoring math is simple, which is why the chart works the same way for everyone:
- The test presents 100 statements about life experiences, ranging from mild to explicit.
- You check every statement that applies to you.
- Each checked box subtracts one point from a starting total of 100.
- Your final score equals 100 minus the number of boxes you checked.
Check 38 boxes and you score 62. Check none and you score 100. There is no weighting — a mild item and an extreme item both cost exactly one point, which is the chart’s biggest limitation and worth remembering when you read your band.
Where Most People Land on the Chart
People Also Ask: What is the most common Rice Purity score?
The most common range is 70–79, which accounts for 32.8% of all submissions — nearly one in three test-takers. The current site-wide average is 74.26, meaning the typical person checks roughly one third of the 100 questions. The distribution is not a symmetrical bell curve: it leans toward the higher end, with a long thin tail running down through the lower scores.
What this means: Scores below 50 are far rarer than most people expect. Combined, the 26–49 and 0–25 bands make up under 10% of all submissions. If you scored in the 40s and assumed that was normal, the data says otherwise.
How This Compares to the Original Rice University Data
The only rigorously documented figure in the test’s history is the Rice University average of 61.46, recorded from 124,952 students before 2018 and published in The Rice Thresher. The current ricepuritytest.bz average of 74.26 sits about six points higher.
The gap has a straightforward explanation. The Rice figure came exclusively from college students during orientation week — a group already well into their social experiences. Online submissions include a much broader age range, including younger users who find the test through TikTok and social platforms, which pulls the average upward.
What Moves a Score on the Chart
- Age. Scores drop sharply between 16 and 22 as ordinary milestones accumulate. A 78 at seventeen and a 62 at twenty-two describe similar people at different stages.
- Environment. College and dorm life compresses years of firsts into a short window, which is why the average Rice Purity score shifts noticeably between student and non-student groups.
- Honesty. Group settings push scores in both directions. People inflate to seem experienced and deflate to seem reserved, and both distort the chart.
How to Read Your Own Position on the Chart
Insight: The chart describes what you have done, not who you are. A band label is a summary of checkboxes, not a character assessment.
The most useful way to use the chart is comparative rather than absolute. Compare your score to people in your own age group and situation, not to the internet at large. A 72 among college seniors reads very differently than a 72 among high school sophomores, even though both sit in the same band.
If your result sits near a band boundary, read both descriptions. The chart draws hard lines at round numbers, but real experience does not. For a fuller take on where the cutoffs actually matter, see what counts as a good Rice Purity score.
Rice Purity Score Chart: Myth vs Reality
| Common Belief | Reality |
|---|---|
| A high score means you are a better person | The chart measures experience, not ethics. There is no “winning” score. |
| A low score means something is wrong with you | Low scores mostly reflect age, environment, and social context. |
| The average score is around 50 | The live average is 74.26. Most people guess far lower than the real figure. |
| The test is a validated psychological assessment | It began as a student icebreaker and has no clinical standing. |
| Every point carries equal weight | All items subtract one point, so mild and severe experiences count the same. |
| A score of 0 is impossible | It is possible but almost always a joke entry — see what a score of 0 actually means. |
| Your score is permanent | Scores only move downward over time, and most people retake the test years apart. |
Frequently Asked Questions
A rice purity score chart is a reference table that maps every possible Rice Purity Test result from 0 to 100 to a band label and a description of what that range typically indicates. It lets you interpret your score at a glance instead of guessing what the number means.
The current average on ricepuritytest.bz is 74.26, based on live anonymous submissions. For historical context, the documented Rice University average was 61.46 from 124,952 students before 2018. Online averages run higher because the audience skews younger and broader than a college orientation group.
The most common range is 70–79, accounting for 32.8% of all submissions on ricepuritytest.bz. That makes it the true center of the real-world distribution — nearly one in three people scores there.
Anything between 60 and 89 is statistically normal, since the majority of test-takers land in that window. The single most common range is 70–79, which alone holds 32.8% of all submissions.
Neither. A higher score means fewer of the listed activities, and a lower score means more. The chart is descriptive, not a ranking, and there is no correct result.
No. Because each checked item permanently subtracts a point, a score can only stay the same or decrease when you retake the test honestly.
There are 100 questions, and each one you check removes a single point from a starting score of 100. That is why the chart runs from 0 to 100 with no gaps.
It accurately counts which boxes you checked, but it does not measure maturity, morality, or personality. Treat the chart as a conversation starter rather than an assessment.
Take the test to find your own place on the chart, then use the bands above to read your result in context rather than in isolation.
