
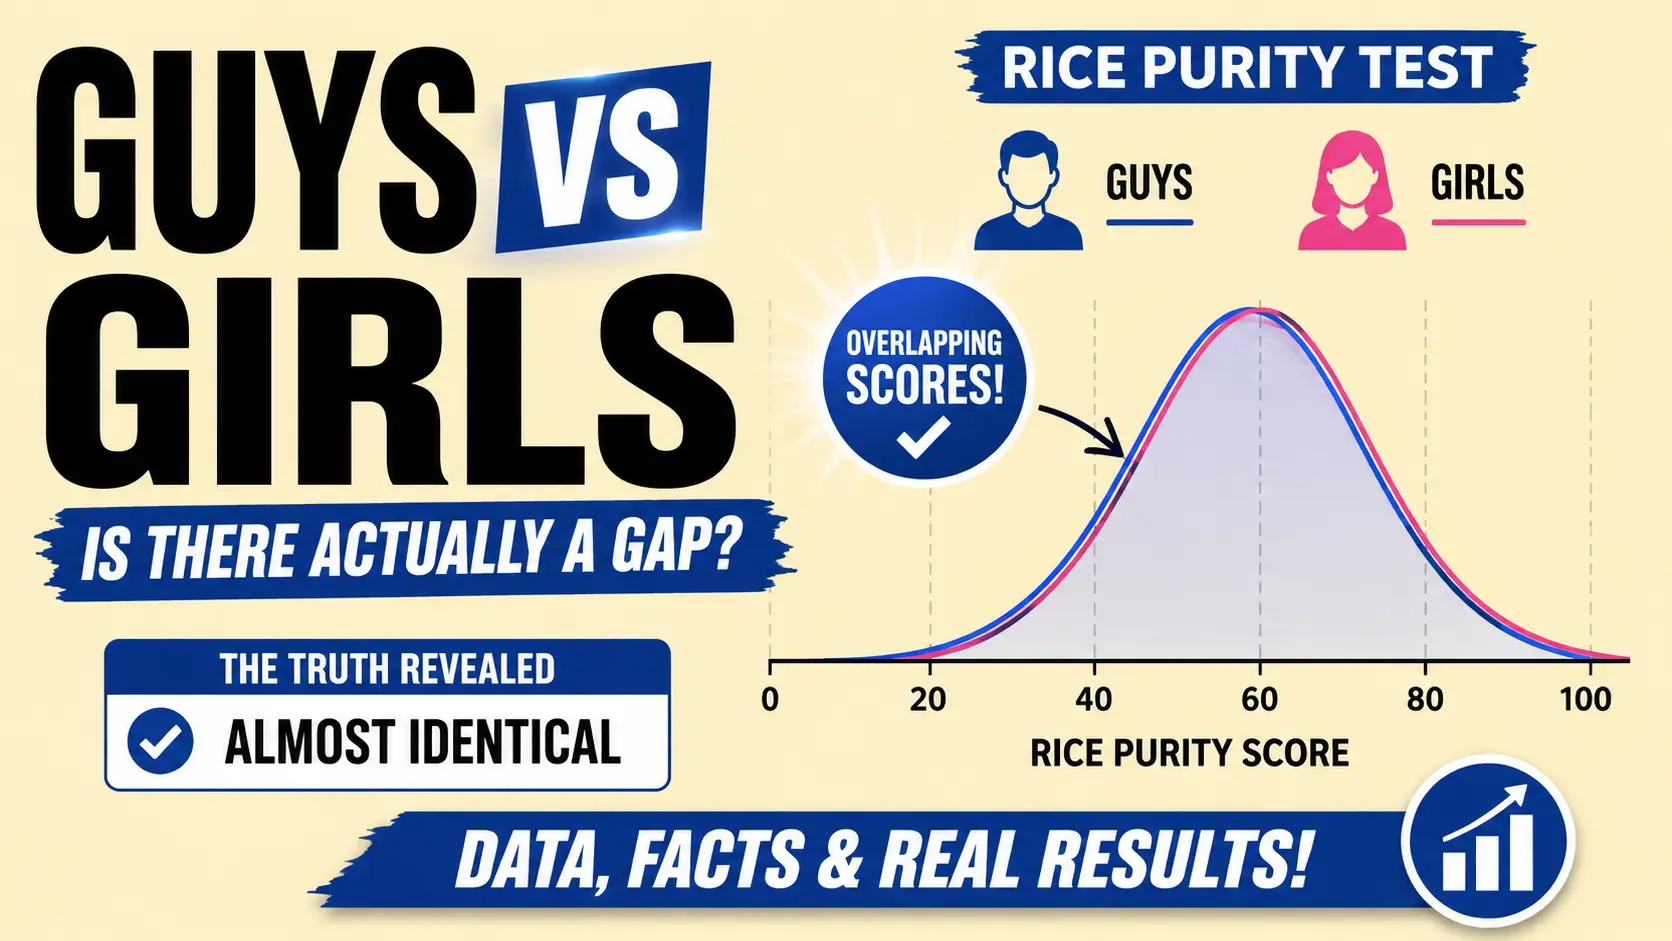
People assume guys and girls score differently on the Rice Purity Test, and plenty of sites publish confident numbers for each. Almost none of those numbers come from anywhere.
Quick Answer: There is no credible gender-split data for the Rice Purity Test. This site records only anonymous scores and does not collect gender, and the original Rice University study was never broken down that way either. Any site publishing separate averages for guys and girls is estimating. What can be said is that the test’s structure makes a large genuine gap unlikely.
Why No Reliable Gender Data Exists
Definition: A gender-split average would require every submission to be tagged with the test-taker’s gender at the moment they submitted. Almost no rice purity test collects that.
Our own submissions record a score and nothing that identifies the person — you can see exactly what is and is not stored in our privacy breakdown. The documented Rice University figure of 61.46 was published as a single number for all respondents, with no gender breakdown.
What this means: When you see “the average score for guys is X,” check where it came from. In most cases the answer is nowhere. Our page on why different sites give different scores covers how these figures spread.
Why a Large Gap Is Unlikely Anyway
People Also Ask: Do guys score lower than girls on the rice purity test?
The test’s structure works against a big difference. Most of the 100 items describe experiences that require another person — dating, kissing, intimacy. Those are shared events, and a shared event gets checked by both people involved.
If two people have a mutual experience, both lose a point. That mechanical symmetry means any real gender gap would have to come from the minority of items that are individual rather than shared: solo experiences, substances, and rule-breaking. Those sections are too small to move an overall average very far.
What Actually Drives Perceived Differences
Insight: The most likely source of any gap is not behavior. It is reporting.
- Social pressure runs opposite directions. Guys face pressure to seem more experienced and girls to seem less, which is the classic distortion in self-reported data on this topic. Both push scores away from the truth, in opposite directions.
- Group settings amplify it. The test spreads through friend groups where people compare results out loud. That is the single worst condition for honest answering.
- Interpretation varies. Vaguely worded items get read differently by different people, adding noise that has nothing to do with gender.
What this means: A measured gap between guys and girls would tell you more about who feels pressure to round which direction than about what anyone has actually done.
The Test Cannot Support the Comparison Anyway
Even with perfect data, the score would not carry the meaning people want from it. Every item deducts exactly one point, so the test cannot distinguish severity, timing, frequency, or context — see how the score is calculated for why that limitation is built into the arithmetic.
Comparing group averages on an instrument that flattens all of that produces a number without a meaning behind it. The far larger and better-documented driver of score differences is age, not gender.
What We Can Say From Real Data
Our submissions do support several things, none of which are gender-specific:
- The most common range is 70–79, holding about a third of all submissions.
- The median score is 76, well above the midpoint of the scale.
- Scores below 50 are genuinely uncommon, accounting for roughly 4% of submissions.
- Scores fall with age and fall faster in college environments.
Full figures are on our live statistics page, which updates with every submission.
Guys vs Girls: Myth vs Reality
| Common Belief | Reality |
|---|---|
| Guys score much lower than girls | No credible data supports this. Most published gender splits are estimates. |
| The original Rice study broke results out by gender | It published a single figure of 61.46 for all respondents. |
| There is a separate test for guys and girls | The same 100 questions are used for everyone, with identical scoring. |
| A gap would prove a behavioral difference | Self-report pressure runs in opposite directions by gender, so any gap likely reflects reporting. |
| Gender explains most score variation | Age is by far the larger and better-documented factor. |
| This site tracks gender | Only an anonymous final score is recorded. No gender, name, or account is collected. |
Frequently Asked Questions
No. The same 100 questions and the same scoring apply to everyone. Nothing about the test changes based on who is taking it.
No credible dataset exists to answer this. This site does not collect gender, and the original Rice University study published one figure for all respondents rather than a split.
There is no reliable figure. Sites publishing separate averages by gender are estimating, since the data required to calculate one is almost never collected.
Most items on the test describe shared experiences, so when two people have a mutual experience, both deduct a point. That symmetry limits how far any real gap could go.
No. Only your final score is stored, as an anonymous number with nothing identifying attached to it.
Age is the largest documented factor, since the test only subtracts points and experiences accumulate over time. Environment and honesty account for most of the rest.
Comparison is where the test distorts most, because people adjust their answers when results are shared aloud. The number is a count of checked boxes, not a measure of anything about a person.
Take the test to see your own score, and read it as a count rather than a comparison.
