
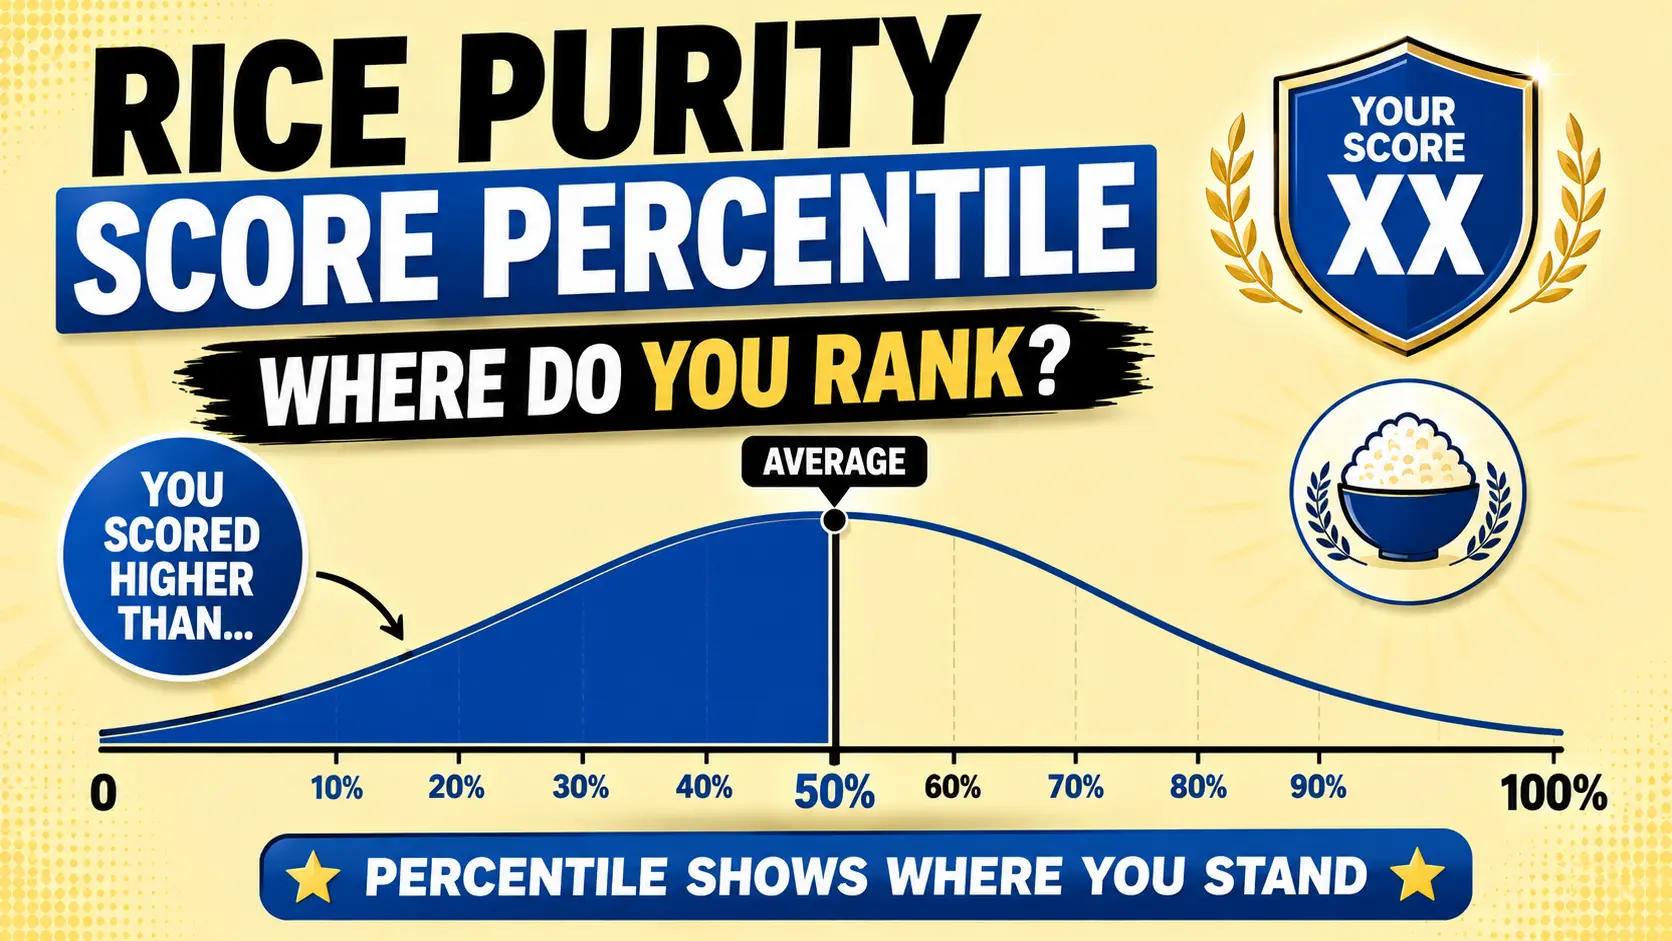
Your rice purity score tells you what you have done. Your percentile tells you how that compares to everyone else — which is usually the thing people actually want to know. This page ranks every score range against live data from over 125,000 real submissions.
Quick Answer: A rice purity score percentile shows what percentage of test-takers scored lower than you. A score of 70 places you above roughly 30% of submissions, a score of 80 above roughly 63%, and a score of 90 above roughly 90%. Because higher scores mean fewer checked experiences, a high percentile means you have done less than most people who took the test.
What Is a Rice Purity Score Percentile?
Definition: A rice purity score percentile is the percentage of test-takers whose score was lower than yours. If your score falls at the 75th percentile, 75% of people scored below you and 25% scored above.
One thing trips people up constantly, so it is worth stating plainly: on this test, a lower score means more life experience. So a high percentile does not mean you have done more — it means the opposite. Someone at the 90th percentile has checked fewer boxes than 90% of test-takers.
Throughout this page, percentile always means the share of submissions that scored below you. Every figure comes from live anonymous data recorded on ricepuritytest.bz as of October 2026.
Rice Purity Score Percentile Chart
Find your score range in the left column to see where you rank. This table updates automatically with every new submission.
| Score Range | Percentile Range | You Rank Above | What That Means |
|---|---|---|---|
| 90–100 | 90th–100th | 90%+ of test-takers | Top tier. Very few checked experiences compared to almost everyone. |
| 80–89 | 63rd–89th | 63–89% of test-takers | Well above average. A small handful of mild experiences. |
| 70–79 | 30th–62nd | 30–62% of test-takers | The most crowded band, holding 32.7% of submissions, contains both the median (76) and estimated average (74.22). |
| 60–69 | 11th–29th | 11–29% of test-takers | Broad experience across dating, drinking, and mild rule-breaking. |
| 50–59 | 4th–10th | 4–10% of test-takers | Below average. Less common than most people assume. |
| 26–49 | 1st–3rd | 1–3% of test-takers | Bottom tier. Extensive experience across most categories. |
| 0–25 | 0th–1st | Under 1% of test-takers | The rarest outcome on the test. |
Insight: The distribution is heavily lopsided. A single ten-point band holds nearly a third of all submissions, so percentiles move very fast through the 70s and very slowly at the extremes. Dropping from 79 to 70 shifts your rank by more than 30 percentile points; dropping from 25 to 16 barely moves it at all. For the full band-by-band breakdown, see our complete rice purity score chart.
The Median Score Is 76, Not 50
People Also Ask: What is the middle rice purity score?
The median — the score where exactly half of all submissions fall above and half below — sits at approximately 76. That is far higher than most people assume before they see the data. Almost everyone guesses somewhere near 50, because 50 is the midpoint of the scale, and they mistake the midpoint of the scale for the midpoint of the people.
What this means: If you scored 65 and felt that was low, the raw number was misleading you. A 65 sits in the 11th–29th percentile range, meaning most test-takers scored higher — but it is also only eleven points off the median, which is a much smaller gap than the percentile suggests. Crowded distributions exaggerate small differences.
Only 4% of Test-Takers Score Below 50
This is the single most surprising figure in the dataset. Scores under 50 — the ones people assume are common — account for roughly 4% of all submissions combined. Scores under 26 account for well under 1%.
Meanwhile the top of the scale is far more populated than expected. About 10% of test-takers score 90 or above, and more than a third land in the 80s and 90s together. The curve leans strongly toward the high end with a long, thin tail running down through the low scores. See the live statistics distribution for current exact figures.
How to Read Your Own Percentile
Three things are worth knowing before you take your rank too seriously:
- Percentile is an estimate. Bands are ten points wide and scores are not evenly spread inside them, so treat any figure here as accurate within a few points rather than exact.
- Your comparison group is everyone. The chart ranks you against all submissions, not against people your age. A 72 among college seniors and a 72 among high school sophomores occupy the same row but describe very different situations.
- Rank is not judgment. A low percentile reflects age, environment, and honesty far more than anything about you as a person. Our guide to what counts as a good rice purity score covers this in more depth.
How This Compares to the Original Rice University Data
The only rigorously documented figure in the test’s history is the Rice University average of 61.46, recorded from 124,952 students before 2018 and published in The Rice Thresher. Our submissions skew noticeably higher.
The gap has a straightforward explanation. The Rice figure came exclusively from college students during orientation week — a group already well into their social experiences. Online submissions include a much broader age range, including younger users who find the test through social platforms, which pulls the distribution upward. Our sample has now passed the original study in raw volume, though the two count different things: Rice counted individual students, while we count submissions, and the same person can retake the test.
Percentile Myths vs Reality
| Common Belief | Reality |
|---|---|
| A high percentile means more experience | The reverse. High percentile means a high score, which means fewer checked items. |
| The 50th percentile is a score of 50 | The median sits near 76. Only about 4% of test-takers score below 50 at all. |
| Percentiles are evenly spaced | One band holds nearly a third of submissions, so percentiles bunch heavily around the 70s. |
| Scoring in the 60s means you are unusual | The 60s hold nearly 20% of all submissions — one of the most populated ranges on the chart. |
| A low percentile is something to worry about | It reflects age, environment, and honesty far more than anything about you as a person. |
| Your percentile is fixed | It shifts as new submissions come in and as your own score changes over time. |
Frequently Asked Questions
A rice purity score percentile is the percentage of test-takers who scored lower than you. At the 80th percentile, 80% of submissions scored below your number and 20% scored above it.
A score of 70 sits at the bottom edge of the 70–79 band, placing it at roughly the 30th percentile. About 30% of test-takers scored lower and about 70% scored higher, which makes 70 noticeably below the median of 76.
The median is approximately 76, meaning half of all submissions score above it and half below. This is much higher than most people expect, because they assume the middle of the scale is also the middle of the population.
No, it means the opposite. Higher scores indicate fewer checked experiences, so a high percentile means you have done less than most test-takers, not more.
Roughly 4% of all submissions fall below 50, combining the 26–49 and 0–25 ranges. Scores under 26 account for well under 1%, making them the rarest outcome on the test.
A score of 100 sits at the very top of the distribution, above the 90–100 band that holds approximately 10% of submissions. Perfect scores specifically are much rarer than that band as a whole.
It is calculated by adding the number of submissions in every score band below yours and dividing by the total number of submissions. All figures come from live anonymous data recorded on this site and update with every new entry.
They are accurate to within a few points. Score bands are ten points wide and results are not evenly distributed inside them, so percentile figures are close estimates rather than exact rankings.
Take the test to get your score, then come back to this chart to see exactly where you land.
