
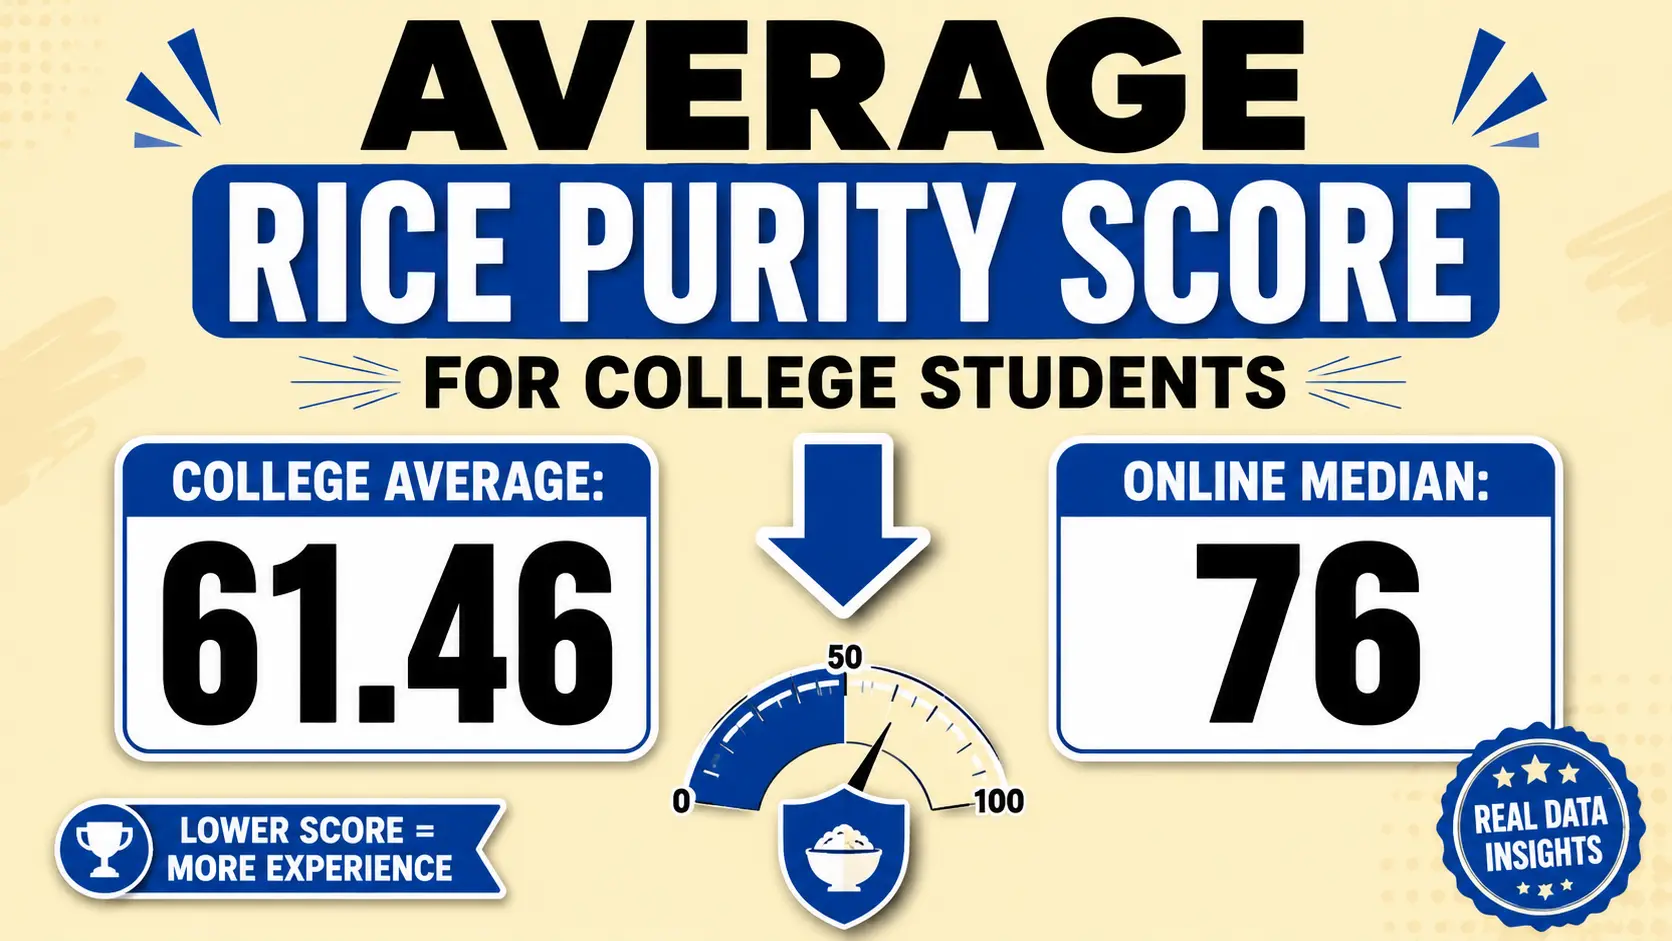
Quick Answer: The only rigorously documented college figure is 61.46, recorded from 124,952 Rice University students at orientation week and published in The Rice Thresher. That is roughly fifteen points below the median of 76 across general online submissions. College students score lower because campus life compresses years of ordinary milestones into a short window.
The Documented College Average
Definition: The Rice University average of 61.46 is the only large-sample college figure ever formally published, drawn from students taking the test during orientation before 2018.
Two details make it more useful than it first appears. It came from a single institution, so the sample is narrow. But it was collected at orientation week — meaning it captures students as they arrive, before college itself has had any effect.
What this means: 61.46 is best read as an incoming-freshman baseline rather than a college-wide average. Scores for students further into their degree would run lower still, since the test only moves in one direction.
Why College Scores Sit Below the Online Average
People Also Ask: Why do college students have lower rice purity scores?
The median across submissions on this site is 76, well above the documented college figure. Two things explain the gap, and neither is about college students being different people:
- Audience age. Online submissions skew young — a large share come from high school users who find the test through social platforms. That pulls the general median upward, since fewer items apply to them yet.
- Accumulation. The test never resets. Every experience permanently subtracts a point, so any older group will score lower than a younger one by simple arithmetic. See how the score is calculated for why scores only move downward.
How the Score Shifts From Freshman to Senior
Insight: There is no published year-by-year college dataset, so what follows describes the mechanism rather than measured averages.
The test’s structure makes the progression fairly predictable. Different sections fill in at different stages:
- Arriving freshmen have typically completed the dating, kissing, and solo sections, with a handful of alcohol items. The physical and sexual experience blocks are partially filled at most.
- The first year tends to move the alcohol and party items fastest. Dorm living and the absence of parental oversight compress a lot of firsts into a few months.
- The middle years are where the physical intimacy and sexual experience sections fill in, along with the settings and frequency block. This is usually the steepest drop.
- Seniors tend to add fewer new items but sit much lower than they started, since nothing they checked earlier ever comes back.
What this means: A senior scoring in the 50s and a freshman scoring in the 70s often describe the same person at different points. Comparing across class years tells you about elapsed time, not about the people. Our breakdown of every score range covers what each band actually indicates.
What Campus Life Actually Changes
Three features of college move the number more than anything else:
- Density. Living among hundreds of people your own age creates more opportunity in a year than most high school environments create in three.
- Independence. No curfew and no supervision removes most of the friction that slows the substance and party sections.
- Social norms. The test began as an orientation icebreaker, and it still circulates in group settings where people compare scores — which is exactly the situation that distorts honest answering in both directions.
Should College Students Read Anything Into Their Score?
Not much. The test weighs every item equally, so a score cannot distinguish between forty mild experiences and forty serious ones, and it has no way to account for the fact that the same person scores lower each year simply by existing.
A falling score through college is the expected outcome, not a signal about anything. Our page on what counts as a bad score covers why no result carries the meaning people assign to it.
College Scores: Myth vs Reality
| Common Belief | Reality |
|---|---|
| 61.46 is the college-wide average | It was collected at orientation, making it an incoming-freshman baseline. |
| There is published data by class year | No large-sample freshman-to-senior dataset has ever been published. |
| College lowers your score because of who goes there | It lowers scores because time passes and the test never resets. |
| A low senior score means something | Four more years of ordinary life will lower anyone’s score. That is arithmetic, not character. |
| Online averages apply to college students | Online submissions skew younger, which is why the general median runs well above the college figure. |
| Group score comparisons are accurate | Comparing in a room is the single most distorting condition for honest answering. |
Frequently Asked Questions
The only documented figure is 61.46, from 124,952 Rice University students at orientation week before 2018. Because it was collected as students arrived, it functions as an incoming-freshman baseline rather than a college-wide average.
Generally yes, though not because of anything about college students themselves. The test only subtracts points, so any older group scores lower than a younger one simply through accumulated time.
The Rice orientation figure of 61.46 is the closest documented answer, since it captured students at the start of their first year.
No large-sample dataset broken down by freshman, sophomore, junior, and senior has ever been published. Any year-by-year figures you see online are estimates rather than measurements.
Online submissions skew much younger, with a large share coming from high school users. Fewer items apply to them, which pulls the general median up to around 76.
No. Scores fall for everyone as time passes, so a lower score later in a degree reflects elapsed years rather than anything about the person.
It was published in The Rice Thresher, the university’s student newspaper, based on 124,952 student responses recorded before 2018.
Take the test to see your own score, then read it against your stage of life rather than against everyone else’s number.
