
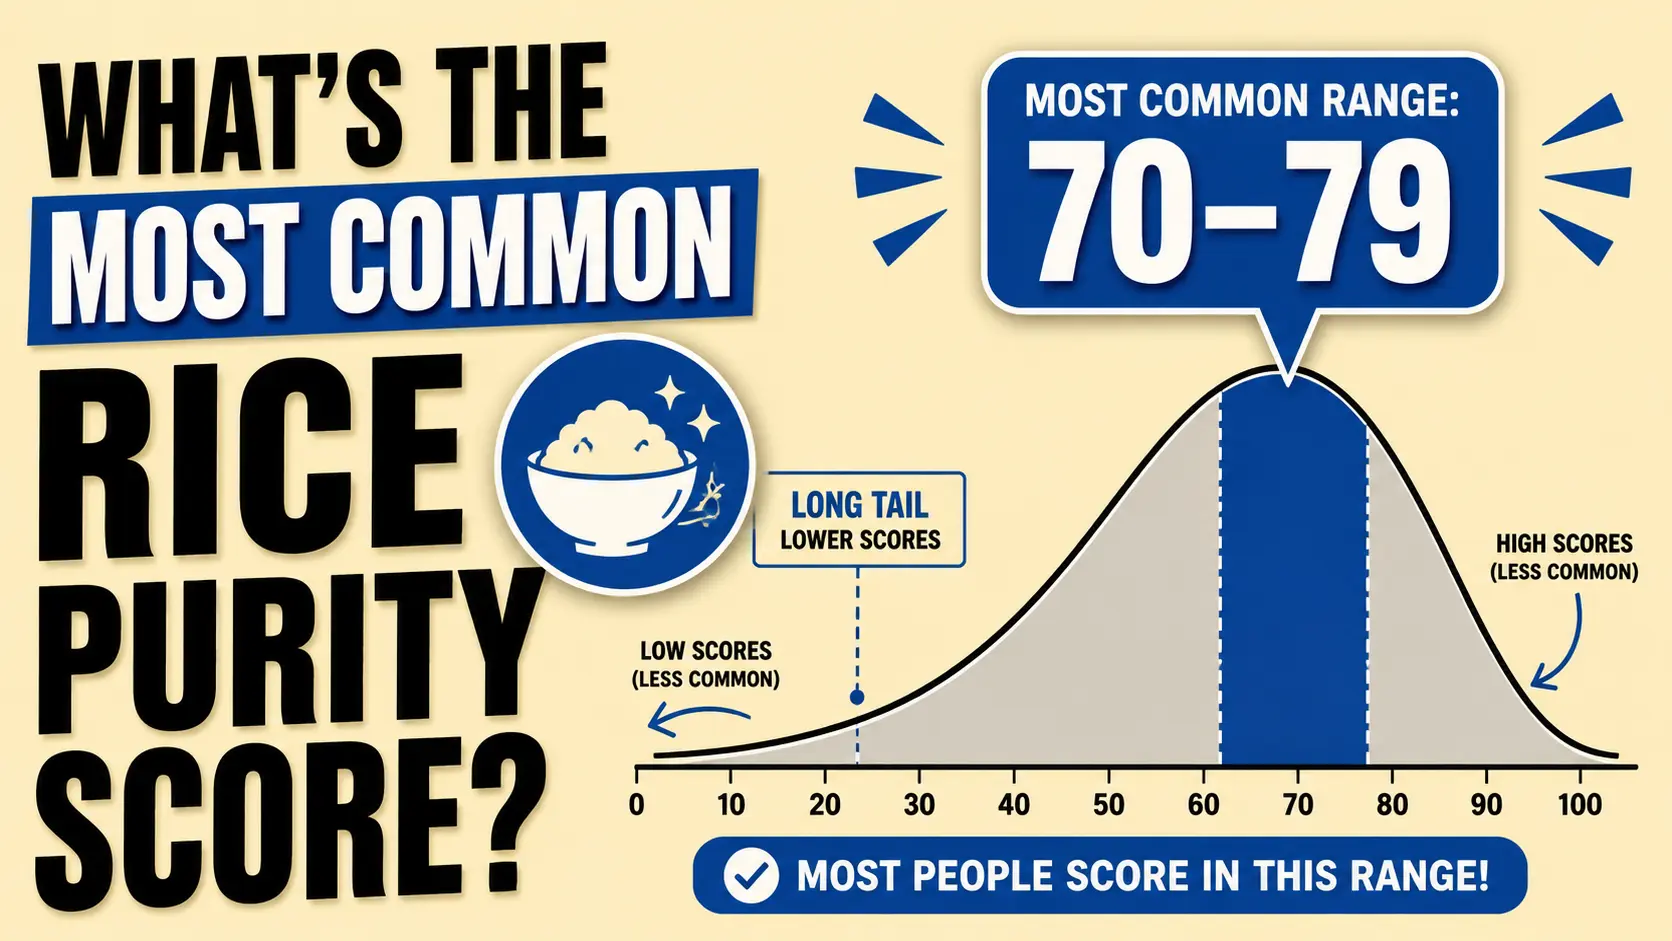
Quick Answer: The most common rice purity score range is 70–79, which holds roughly a third of all submissions on this site — more than any other band by a wide margin. The median score is 76. The distribution is heavily skewed toward the high end, so the most common range sits well above the middle of the 0–100 scale.
The Most Common Range: 70–79
Definition: The most common range is the score band that more test-takers land in than any other — what statisticians call the mode.
Across submissions on this site, the 70–79 band holds about a third of everyone. That is a striking concentration for a ten-point window on a hundred-point scale. If scores were spread evenly, each ten-point band would hold roughly a tenth.
What this means: Scoring in the 70s is the single most ordinary outcome on the test. It is also where the median falls, at 76, meaning half of all submissions land above that point and half below.
Every Range, Ranked by How Common It Is
Ordered from most to least common rather than by score:
| Rank | Score Range | Share of Submissions |
|---|---|---|
| 1 | 70–79 | About a third |
| 2 | 80–89 | About a quarter |
| 3 | 60–69 | About a fifth |
| 4 | 90–100 | Roughly 10% |
| 5 | 50–59 | Under 7% |
| 6 | 26–49 | About 3% |
| 7 | 0–25 | Well under 1% |
The top three bands together account for roughly four out of every five submissions. For current exact figures, see our live statistics page.
Most Common Is Not the Same as Average
People Also Ask: Is the most common rice purity score the same as the average?
No, and the difference is the most useful thing on this page. Three separate numbers describe the same dataset:
- The mode is the most crowded band — 70–79. It tells you where people cluster.
- The median is the true middle, at 76. Half of submissions fall on either side of it.
- The mean is the arithmetic average, which sits lower than the median because a small number of very low scores drag it down.
Insight: When the mean sits below the median, the distribution has a long tail on the low side. That is exactly what happens here — the vast majority of scores bunch in the 60s through 90s, while a thin trail of very low scores pulls the average down without moving the crowd. Our page on the average rice purity score covers that figure specifically.
Why the Curve Is Shaped This Way
Three things produce the skew:
- The question order. The early sections cover dating, kissing, and solo experiences — items most people check. The later sections cover substances, legal trouble, and higher-risk experiences, which most people do not. That structure naturally piles scores into the 70s and 80s.
- The audience. Online submissions skew young. Fewer items apply yet, which pushes the whole distribution upward compared with the documented college figure.
- The floor effect. Reaching a very low score requires checking almost everything, including the rarest items. Very few people can, which is why the bottom bands are nearly empty.
What This Means for Your Own Score
If you scored in the 70s, you are in the largest group on the test. If you scored in the 60s or 80s, you are still in one of the three most populated bands. Together those three hold about four out of five submissions.
What this means: Scores outside that window feel more unusual than they are common — but rarity is not a verdict. A 55 is uncommon and a 95 is uncommon, and neither indicates anything about the person. See what each score range means for a band-by-band breakdown, or our percentile breakdown for exactly where any score ranks.
Most Common Score: Myth vs Reality
| Common Belief | Reality |
|---|---|
| The most common score is around 50 | The most crowded band is 70–79. The 50s hold under 7% of submissions. |
| The most common score is the average | They are different measures. The mean sits below both the mode and the median here. |
| Scores are spread fairly evenly | One band holds about a third of everyone; another holds well under 1%. |
| The middle of the scale is the middle of the people | The median is 76. A score of 50 already sits in the bottom 10%. |
| Very low scores are common among students | They are rare everywhere. Reaching the bottom bands requires checking nearly every item. |
| These figures apply to the general population | They describe people who chose to take an online quiz, not any representative sample. |
Frequently Asked Questions
The most common range is 70–79, which holds about a third of all submissions on this site. That is more than double the share of any evenly distributed band would be.
No. The most common range is 70–79 and the median is 76, while the mean sits lower because a small number of very low scores pull it down.
The 80–89 band, holding roughly a quarter of all submissions. The 60–69 band comes third at about a fifth.
The test’s early sections cover experiences most people have had, while the later sections cover ones most have not. That structure concentrates scores in the 70s and 80s.
The 0–25 band, which holds well under 1% of all submissions. Reaching it requires checking at least 75 of the 100 items.
It is the most ordinary result rather than a good or bad one. The test counts experiences and applies no judgment to any range.
No. They describe people who chose to take an online purity test, an audience that skews young and social-media-driven, so they are not population statistics.
Take the test to see where your own score falls on the curve.
